top of page

Salon + Service Business Money

Your client retention rate is the regulars still booking at the end of a year, divided by the regulars you had at the start. If 45 of 60 are still with you, it is 75%.


It is the quietest number in a service business. A client who stops coming does not send a cancellation. She simply is not in the diary, and a full week hides the gap.


Here is how to work it out from records you already have, what one lost regular is worth, and where to look when the figure slips.


Income sorted by source in the Money Mastery System

Income by client is where a missing regular shows up first. Example data.


The short version


  • Retention rate = regulars still booking ÷ regulars at the start × 100.

  • A regular is worth her price times her visits in a year.

  • Keeping a client costs less effort than finding a new one.

  • Check it twice a year. Once is a snapshot, twice is a trend.


How to work it out


  1. Decide what a regular is. For example, anyone who booked at least three times in a year.

  2. List your regulars from twelve months ago. Your income records by client will give you the names.

  3. Mark each one who has booked in the last three months.

  4. Divide the marked names by the whole list, and multiply by 100.


Line

Number

Regulars twelve months ago

60

Still booking today

45

No longer booking

15

Retention rate

75%


What a regular is worth


Multiply what she pays per visit by how often she comes in a year.


Line

Amount

Price per visit

$95

Visits a year

9

One regular, for one year

$855

The fifteen who left

$12,825


Fifteen clients did not leave in one week. They left one at a time, about one every three and a half weeks, and no single month looked different. Added up, they were worth $12,825 a year.


That is before counting the friends they would have sent, and the years they would have stayed.


What ten points of retention is worth


Retention

Regulars kept, of 60

Yearly income from them

65%

39

$33,345

75%

45

$38,475

85%

51

$43,605


Moving from 75% to 85% keeps six more clients and is worth $5,130 a year, every year, without a single new booking. Six clients is a number you can picture. You may be able to name them.


Why keeping beats finding


A new client costs you time before she pays you anything: the enquiry, the consultation, the first appointment that runs long. A regular has none of that. She knows the price, the place and how you work.


So the same $855 is cheaper to earn from someone who is already yours. This is why a business with steady regulars feels calmer than one with the same income from a stream of new faces.
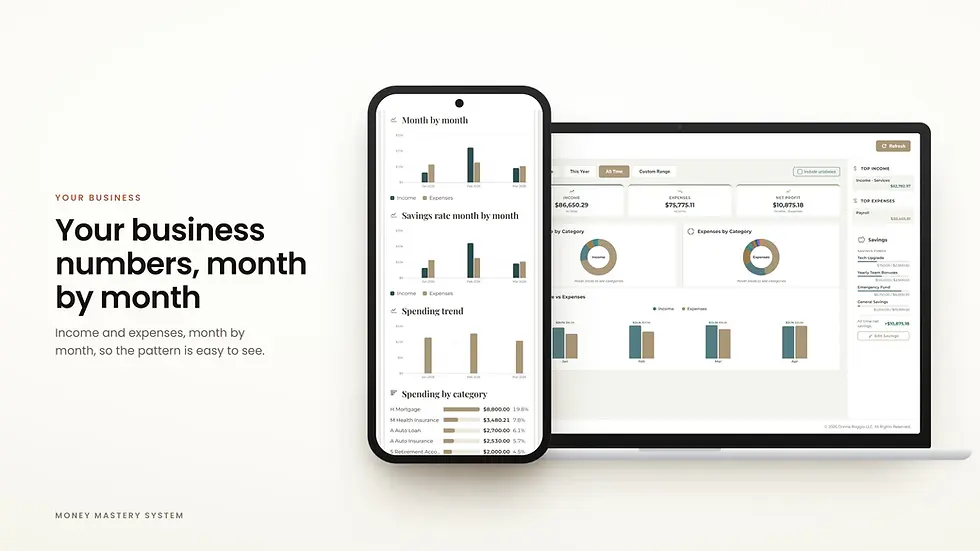

The Money Mastery System business dashboard with income by month

A steady base makes the monthly line flatter. Example data.


Where regulars go


  1. They moved or their life changed. Nothing to fix, and worth knowing how many.

  2. They were never asked to rebook. The most common reason, and the easiest to change.

  3. The price rose without a word. People accept a rise far more readily when they are told first.

  4. Something went wrong once and nobody followed up.

  5. They drifted. A longer gap than usual became a habit.


Five habits that hold the number


  1. Rebook before she leaves. A next appointment already in the diary is the simplest way to make sure she comes back.

  2. Keep a list of anyone overdue. If she usually comes every six weeks and it has been ten, send a note.

  3. Tell regulars about a price change in person, a month ahead.

  4. Follow up after anything that went less than well.

  5. Thank the long-standing ones. It costs nothing and it is noticed.


What is a good retention rate?


It depends on what you do. Someone seen every six weeks for years will have a higher figure than someone hired for a single project. The useful comparison is your own rate six months ago, and whether you know the reason for the change.


Three mistakes


  1. Counting everyone who ever booked. One-time clients are a different question. Measure regulars.

  2. Looking only at income. New clients can replace lost income for a while and hide a falling rate.

  3. Waiting for a quiet month to notice. By then the pattern is a year old.


If your regulars are the base of the business, they also set your break-even. Our post on the break-even point for a service business shows how many sessions a month the business needs before it supports you.


Start with the whole picture, free


La Soglia, the free membership of the Money Mastery System, holds everything you own and owe in one place, personal and business together, with no bank connection and no card. Income sorted by source, which is where the list of regulars comes from, is part of the paid membership.


Bring it to the Collective


How do you ask a client to rebook without it feeling like a pitch? The Money Mastery Collective has a discussion feed open on the free membership. Swap wording there.


Questions we hear


How do I calculate client retention rate?

Divide the regular clients still booking at the end of a period by the regulars you had at the start, and multiply by 100.

What is a good client retention rate?

It varies by type of service. Compare your own rate with six months ago and look for the reason behind any change.

How much is a regular client worth?

Her price per visit times her visits in a year. At $95 and nine visits, that is $855 a year.

Why do clients stop coming?

Often nobody asked them to rebook. Other reasons include an unannounced price rise, a poor experience that was not followed up, or a change in their own life.


References


There are no outside figures in this post. Every number is our own worked example.


Start free with La Soglia


La Soglia is the free membership of the Money Mastery System. It gives you the Net Worth Tracker, where everything you own and everything you owe sits in one place, and the Money Mastery Collective. There is no card to enter and no bank connection.


Keep in touch


Donna shares a short version of posts like this one on Instagram and LinkedIn. Follow along there, or find everything in one place on our links page.


A note on what this is


This article is educational. The Money Mastery System is an educational tool, not financial software, and nothing here is legal, tax, investment or financial advice. The figures are illustrations, and your own prices, visit frequency and client base will differ. For guidance on your own circumstances, please speak with a qualified professional who knows them.

Product should run about 8% of service revenue. Plenty of salons are at 12% and do not know it.


On $120,000 of revenue that gap is $4,800 a year. Nobody stole it. It went down the bowl a quarter ounce at a time.


Product cost is the most forgiving number in a salon, which is exactly why it drifts. Nothing breaks when it rises. It simply takes the difference out of what you keep.


A Money Mastery Profit and Loss Statement open on a phone for a meal prep kitchen, with $6,100 income, $4,050 expenses and $2,050 net

The Money Mastery System dashboard showing product cost as a share of service revenue. Example data.


The short version


  • Each point of product cost is worth 1% of your service revenue, every year.

  • At $120,000 of revenue, running at 12% when you could be at 8% costs $4,800 a year.

  • Count monthly, keep back bar and retail apart, and weigh color.

  • When a supplier raises prices, look at your own.


What the drift is worth


Service revenue

At 8%

At 10%

At 12%

Four points costs

$60,000

$4,800

$6,000

$7,200

$2,400

$90,000

$7,200

$9,000

$10,800

$3,600

$120,000

$9,600

$12,000

$14,400

$4,800

$180,000

$14,400

$18,000

$21,600

$7,200


Every single point of drift is worth 1% of your service revenue, every year, forever. At $120,000 that is $1,200 a point.


Where it actually goes


Five places, in the order they cost you most.


  1. Over-mixing. The most expensive habit in the building, and the one nobody sees, because the excess goes down the drain rather than onto a shelf.

  2. Back bar and retail counted together. Two different businesses with two different margins. Mixed, neither can be managed.

  3. No count. If nobody counts, the percentage is a guess, and a guess drifts in one direction only.

  4. Price rises absorbed. Your supplier raised prices in March and your service prices did not move. The difference came out of your margin silently.

  5. Colour waste on corrections. Sometimes unavoidable. Worth tracking separately so you know what it costs rather than letting it hide in the total.


The five habits that put it back


  1. Count once a month, the same day. Ten minutes.

  2. Separate back bar from retail in your categories, permanently.

  3. Weigh colour. Weighing shows you exactly what each service uses, and nothing else on this list changes the number as quickly.

  4. Re-check your prices when a supplier raises theirs. A supplier increase is a pricing event, not a cost event.

  5. Track corrections separately so the number tells you something rather than just being high.


Money Mastery month view for a meal prep kitchen with $2,450 net profit, the income versus expenses chart and expenses by category

The categorization screen with product costs separated from retail. Example data.


Why this matters more if you rent your chair


If you rent, product is entirely yours, and booth rent vs commission assumed 8% when it worked out where the line falls between the two models.


At 12%, that line moves against you. The grid in that post uses 0.893 as what a renter keeps before rent. At 12% product it is 0.853, and every break-even number rises by about 10%.


So product drift does not only cost you $4,800. It can quietly make renting the wrong answer when it was the right one.


How to work out your own percentage


You need three figures for the same period: what you had on the shelf at the start, what you bought, and what was on the shelf at the end. A quarter works well, because it smooths out one large order.


Line

Amount

Back bar stock at the start of the quarter

$1,200

Back bar product bought

$3,450

Back bar stock at the end

$1,050

Product used: start plus bought minus end

$3,600

Service revenue for the quarter

$30,000

Product cost percentage

12.0%


At 8% this salon would have used $2,400 of product. The difference is $1,200 for the quarter, which is the $4,800 a year from the table at the top.


Leave retail out of every line. Retail product is bought to be sold at a markup, and it belongs in its own sum against retail sales.


Do the sum once and write the result where you order product. The next time you place an order, you will be looking at the number it moves, and that alone tends to change what goes in the basket.


See your own percentage, free


You cannot manage a number you cannot see, and product cost is invisible until somebody separates it out. La Soglia, the free membership of the Money Mastery System, is free with no bank connection and no card. Rise, at $49.99 a month, is what keeps back bar and retail apart automatically, because Clarity remembers how you sorted something last time.


Salon owner bookkeeping starts with three numbers, and this is the second of them.


Bring it to the Collective


Product percentages are the most useful thing salon owners compare, and almost nobody posts them publicly. The Money Mastery Collective discussion feed is open on the free membership.


Questions we hear


Is 8% right for every salon?

No. Colour-heavy salons run higher and dry-styling salons run lower. What matters is your own number, tracked, and which way it is moving.

Should retail be in the percentage?

No. Keep them separate. Retail has its own margin and mixing them hides both.

What about a product charge on the ticket?

It works if it is honest and itemised. It does not fix over-mixing, it just moves who pays for it.

How do I calculate product cost percentage in a salon?

Divide the back bar product you used in a period by your service revenue for the same period, then multiply by 100. Product used is opening stock plus purchases minus closing stock.

How often should I check product cost?

Once a month, on the same day, with a stock count. A quarterly figure smooths out large orders.


The Money Mastery Savings Rate Analysis for a meal prep kitchen, showing a 34 percent savings rate and $2,300 kept, then the rate month by month


Start free with La Soglia


La Soglia is the free membership of the Money Mastery System. It gives you the Net Worth Tracker, where everything you own and everything you owe sits in one place, and the Money Mastery Collective. There is no card to enter and no bank connection.


Keep in touch


Donna shares a short version of posts like this one on Instagram and LinkedIn. Follow along there, or find everything in one place on our links page.


A note on what this is


This article is educational. The Money Mastery System is an educational tool, not financial software, and nothing here is legal, tax, investment or financial advice. The 8% benchmark is a common industry figure, not a rule, and your own number depends on your services and your suppliers. For guidance on your own circumstances, please speak with a qualified professional who knows them.

To take home $40 an hour, you have to charge about $133 an hour.


Not because anybody is being greedy. Because half your week is not billable, expenses come out, tax comes out, and you do not get paid for the weeks you do not work.


Most pricing advice starts from what competitors charge. This starts from what you want to keep, which is the only end of the problem you control.


Money Mastery overview for an interior design practice showing $3,850 income, $2,200 expenses and $1,650 net profit for March 2026

The Money Mastery System dashboard showing income by service against the hours behind it. Example data.


The short version


  • To keep $40 an hour you need to charge about $133, at 50% billable.

  • A price covers five things: the hour, the unbilled hours, costs, tax and time off.

  • Price = what you want to keep ÷ (billable share × 0.8 × 0.75), with your own figures in place of the last two.

  • Quote by the job, using the hourly figure behind the scenes.


What you have to charge, to keep what you want


You want to keep

At 40% billable

At 50% billable

At 60% billable

$25 an hour

$104

$83

$69

$30 an hour

$125

$100

$83

$40 an hour

$167

$133

$111

$50 an hour

$208

$167

$139


This is the true hourly rate calculation run backwards. That post asks what your rate leaves you. This one asks what you must charge to be left with a particular number.


The five layers a price has to cover


A price is not one thing. It is five, stacked.


  1. The hour itself. What you want that hour to pay you.

  2. The hours that do not bill. Quoting, ordering, rescheduling, chasing, the books. At 50% billable this alone doubles the number.

  3. The cost of delivering. Product, tools, software, insurance. About 20% of revenue in a typical service business.

  4. Tax. Nobody is withholding it. A quarter is the usual starting point.

  5. The weeks you do not work. Four unpaid weeks a year adds about 8% to everything above.


Miss any one of them and the price looks fine and the year does not.


The method, in one line


Your price = what you want to keep ÷ (billable share × 0.8 × 0.75)


At 50% billable that divisor is 0.3, which is why a $40 take-home needs a $133 price. Put your own expense share and your own set-aside in place of the 0.8 and the 0.75 and the number becomes properly yours.


Why raising a price is the most efficient thing you can do


Every other lever costs hours. A price rise costs none.


Ten percent more on your price is ten percent more take-home from the same week. Ten percent more clients is ten percent more hours, more admin, more product and more risk, for the same result.


That is the whole argument, and it is why most of the women who feel stuck at their income are not underworked, they are underpriced.


Money Mastery expenses by category for an interior design practice, with Materials & Supplies the largest at $800 of $2,450

Income by service, sorted, with the lowest earner visible. Example data.


Price per job, not per hour


The table is per hour because it is the clearest way to see the layers. Most service businesses should quote per job.


Work out the hours the job really takes, including the parts that never appear on an invoice, then apply the number from the grid. Quote the total. The client gets a price, and you keep the arithmetic.


One job, priced with the grid


A three hour session, for someone who wants to keep $40 an hour and bills half her week.


Line

Quoted at $400

Quoted at $250

Hours with the client

3

3

Unbilled hours behind them, at 50% billable

3

3

After 20% costs

$320

$200

After a 25% set-aside

$240

$150

Kept per hour worked

$40

$25


Three billable hours at $133 is $399, so she quotes $400. Six hours of her week went into it, and $240 is left, which is the $40 an hour she set out to keep.


The right-hand column is the same job at a price that sounds reasonable. It pays $25 an hour, and nothing about the invoice would tell her. This is why the sum is worth doing once for each thing you sell.


Find what each job really pays you, free


The grid needs three of your own figures: your billable share, your expense percentage and your set-aside. La Soglia, the free membership of the Money Mastery System, holds what you own and what you owe in one place, personal and business together, with no bank connection and no card. Rise, at $49.99 a month, is what sorts a year of transactions into the expense percentage without you doing it by hand.


Bring it to the Collective


Prices are the thing women most want a sanity check on before they say the number out loud. The Money Mastery Collective has a discussion feed open on the free membership.


Questions we hear


My competitors charge half this.

Some of them are undercharging, and some have a different cost base. The grid tells you what your price has to be to keep what you want. What you do with that is a business decision, but make it knowing the number.

Can I raise prices on existing clients?

Yes, with notice and without apology. Most people lose fewer clients than they expect and earn more from the ones who stay.

What if my billable share is really low?

Then either your price has to rise or your admin has to fall. Those are the only two doors, and the grid shows you what each is worth.

Does this work for packages?

Yes. Work out the total hours in the package, including delivery and revisions, and apply the same divisor.

How do I work out my hourly rate as a freelancer?

Divide what you want to keep per hour by your billable share, then by what is left after costs and tax. At 50% billable, 20% costs and a 25% set-aside, keeping $40 needs about $133.

What is a billable share?

The part of your working week you can charge a client for. For many one person service businesses it is about half.


Clarity AI answering a question inside the Money Mastery Categorization modal for an interior design practice, naming Materials & Supplies at 33 percent of $2,300 spent rather than giving generic advice


Start free with La Soglia


La Soglia is the free membership of the Money Mastery System. It gives you the Net Worth Tracker, where everything you own and everything you owe sits in one place, and the Money Mastery Collective. There is no card to enter and no bank connection.


Keep in touch


Donna shares a short version of posts like this one on Instagram and LinkedIn. Follow along there, or find everything in one place on our links page.


A note on what this is


This article is educational. The Money Mastery System is an educational tool, not financial software, and nothing here is legal, tax, investment or financial advice. The figures are worked examples from the assumptions stated, not a recommendation about what to charge. For guidance on your own circumstances, please speak with a qualified professional who knows them.

bottom of page